Relative Value Interest Rate Swaps Trades
Advanced analytics for institutional IRS professionals

What it is?
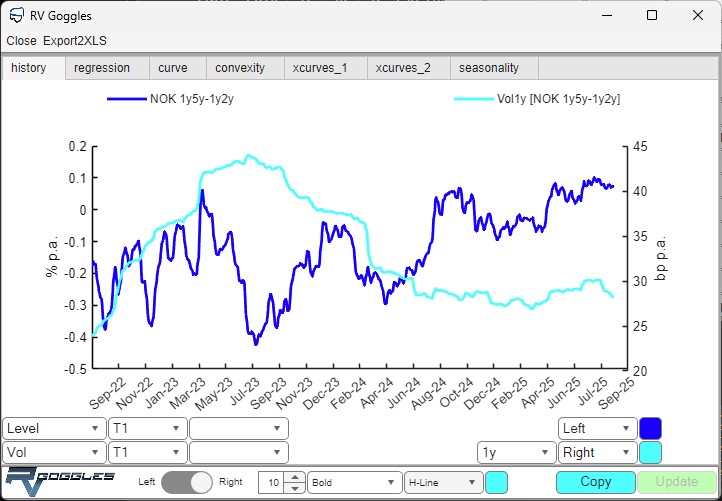
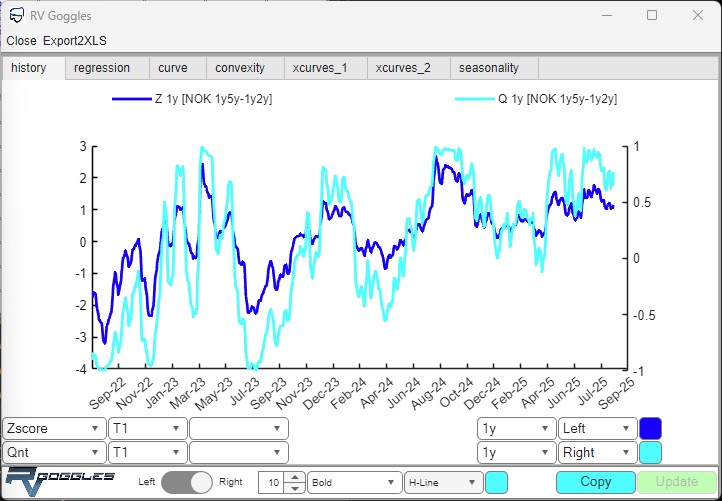
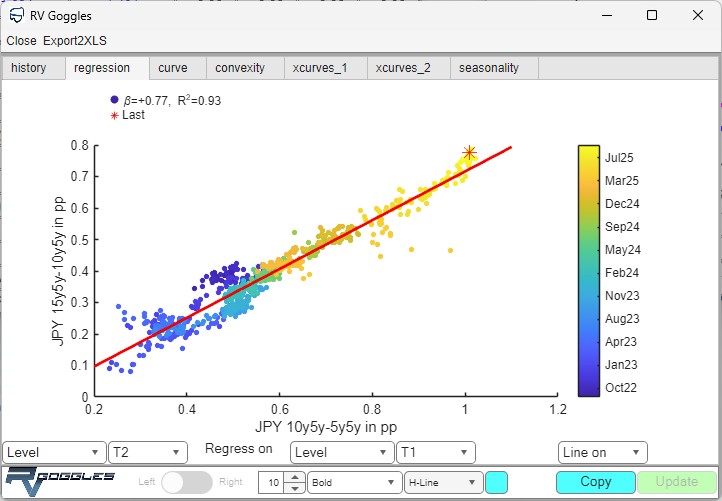
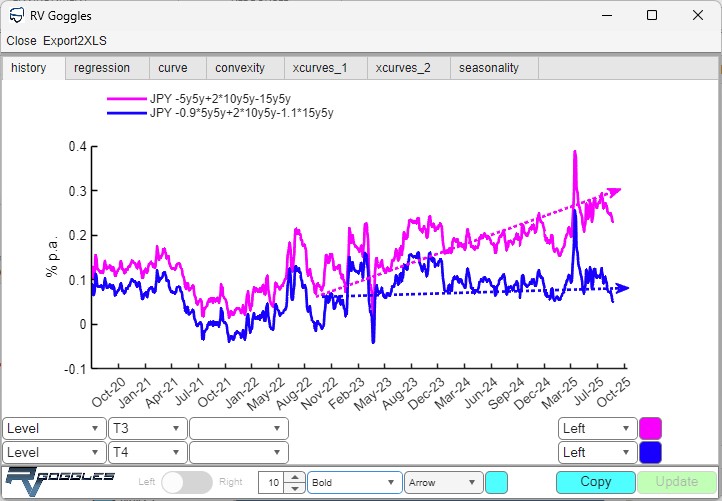
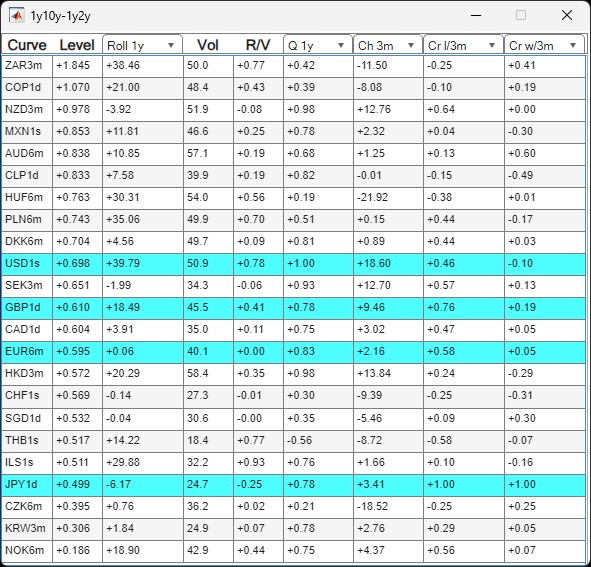
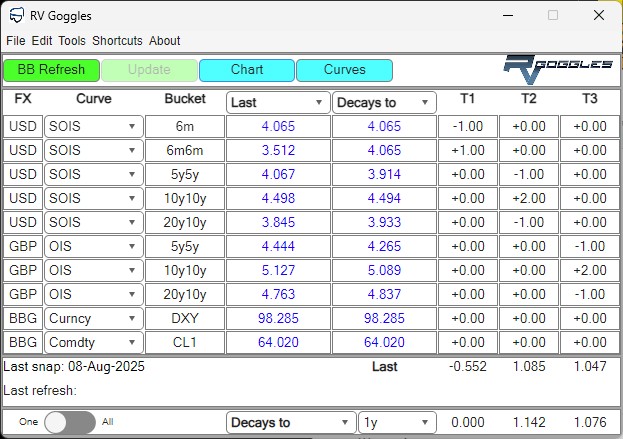
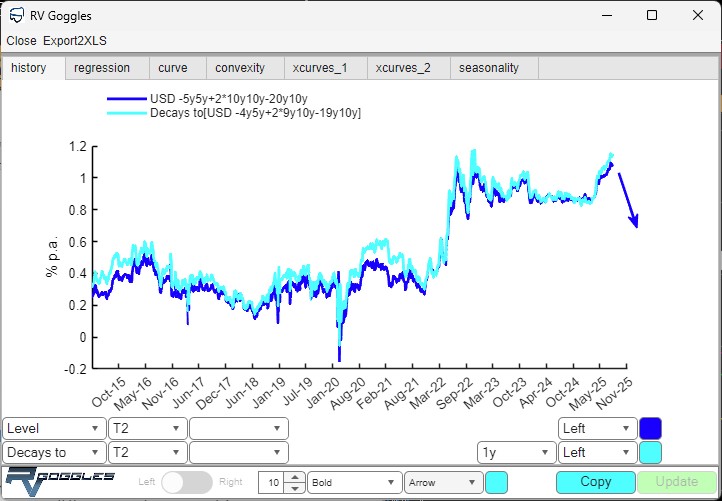
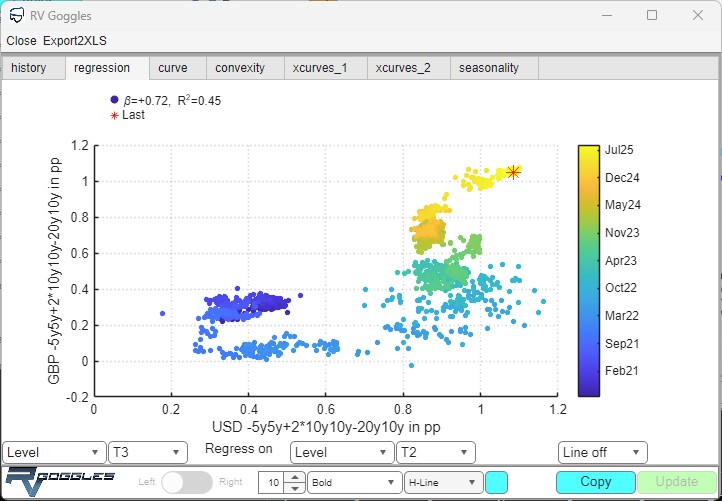
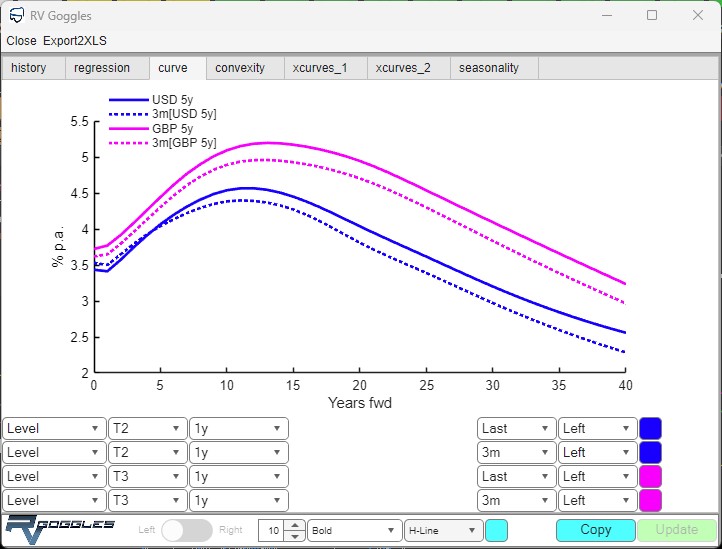
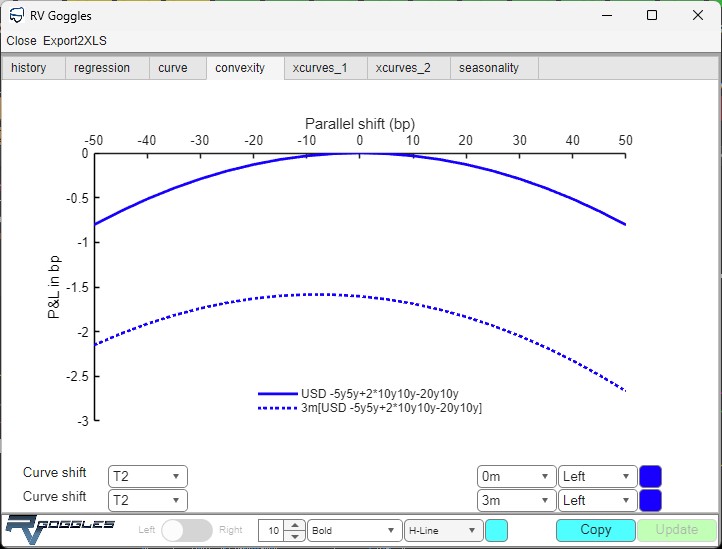
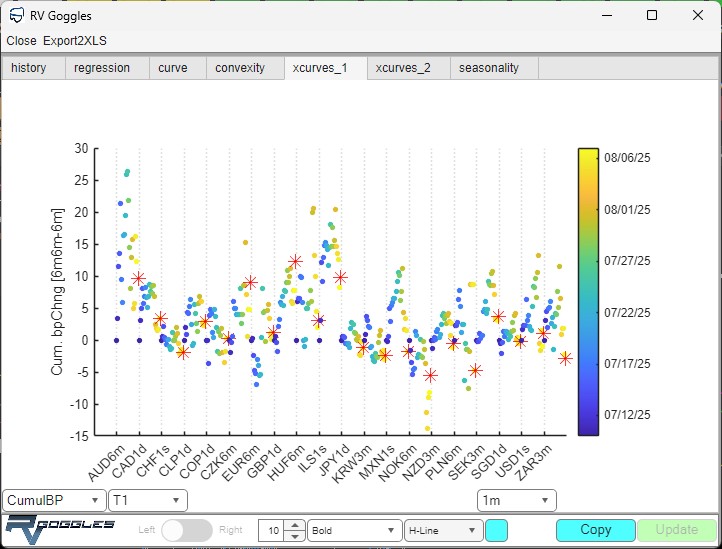
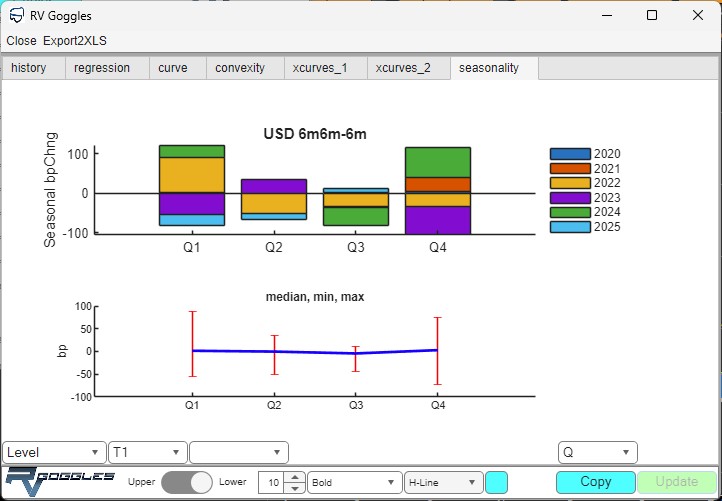
RV Goggles is a proprietary software for analysis and charting of relative value interest rates swap trades. The user can define any linear RV trade combining forward interest rates on one or more swap curves. RV Goggles shows a set of statistics describing entry point relative to its history and rolldown and offers one-click comparison with pre-defined trades on a single curve or the same trade on all available curves. RV Goggles offers seven types of charts: basic time series history of trade, its roll or correlation, regression chart with a linear fit, two types of cross-curve charts, roll-down chart, convexity chart, and seasonality chart. Each chart is scalable, the user can apply moving average smoothing, change colours, annotate the chart and, finally, copy and past the chart into an email or a presentation.
For whom it is?
RV Goggles is a tool for traders, portfolio managers and finance quants active in interest rate swap markets. The user can quickly double-check if the intended RV trade cannot be expressed in a simpler way or more efficiently on a different curve. RV Goggles do not make any forecasting, back testing, or trade recommendations. However, the data is exportable and can be used separately (outside RV Goggles) for an algorithmic trade search, trade optimisation or back tests. RV Goggles is using our proprietary daily data of more than 35 swap curves, each curve having at least 10 years of history. RV Goggles works with mid-rates and is not meant to be a pricing tool.
How it works?
RV Goggles are coded in Matlab and distributed in the form of an executable file which runs on a local PC. The user has to install Matlab Runtime (provided by MathWorks for free) which is a standalone set of libraries enabling to run the compiled code. Further, the user needs login credentials to our data. Both RV Goggles and the data are complimentary service for our existing clients. This web is not a promotion or a commercial offer but a help page for existing RV Goggles users.
Analytics & Trade Idea Generation
Visualizations powered by advanced quantitative models

Why RV Goggles
Application designed by ex IRS RV portfolio managers
Portfolio Manager Focused
Designed specifically for institutional portfolio managers with intuitive interfaces and relevant metrics. Unlike other systems, RV Goggles offers quick relative value trade analysis and comparison across peers.
Proprietary Market Data
Proprietary daily data of 30+ interest rate swap curves. The data is manually checked for misquotes and stored in the form of discount factor curves, giving RV Goggles flexibility to price a wide range of cash flows.
AWS / Matlab Powered Analytics
Coded in Matlab and distributed as a compiled standalone application running under MathWorks Distributed Runtime. Features AWS-powered data storage and authentication.